Support Questions
- Cloudera Community
- Support
- Support Questions
- Re: Unable to visualize tweets on Banana.
- Subscribe to RSS Feed
- Mark Question as New
- Mark Question as Read
- Float this Question for Current User
- Bookmark
- Subscribe
- Mute
- Printer Friendly Page
- Subscribe to RSS Feed
- Mark Question as New
- Mark Question as Read
- Float this Question for Current User
- Bookmark
- Subscribe
- Mute
- Printer Friendly Page
Unable to visualize tweets on Banana.
- Labels:
-
Apache Ambari
-
Apache NiFi
-
Apache Solr
Created on 10-29-2016 11:39 AM - edited 08-18-2019 05:17 AM
- Mark as New
- Bookmark
- Subscribe
- Mute
- Subscribe to RSS Feed
- Permalink
- Report Inappropriate Content
I am trying to do a POC of sentiments analysis using nifi and banana. I was able to setup everything but unfortunately I am unable to see any data in Banana, however I can see sometimes data are coming in nifi. Please see the below screenshot to have a look at the error.

I had almost tried everything that was mentioned everywhere as a solution like switching off the firewall, making sure about the port forwarding in virtualbox etc.
Created on 11-02-2016 06:56 PM - edited 08-18-2019 05:17 AM
- Mark as New
- Bookmark
- Subscribe
- Mute
- Subscribe to RSS Feed
- Permalink
- Report Inappropriate Content
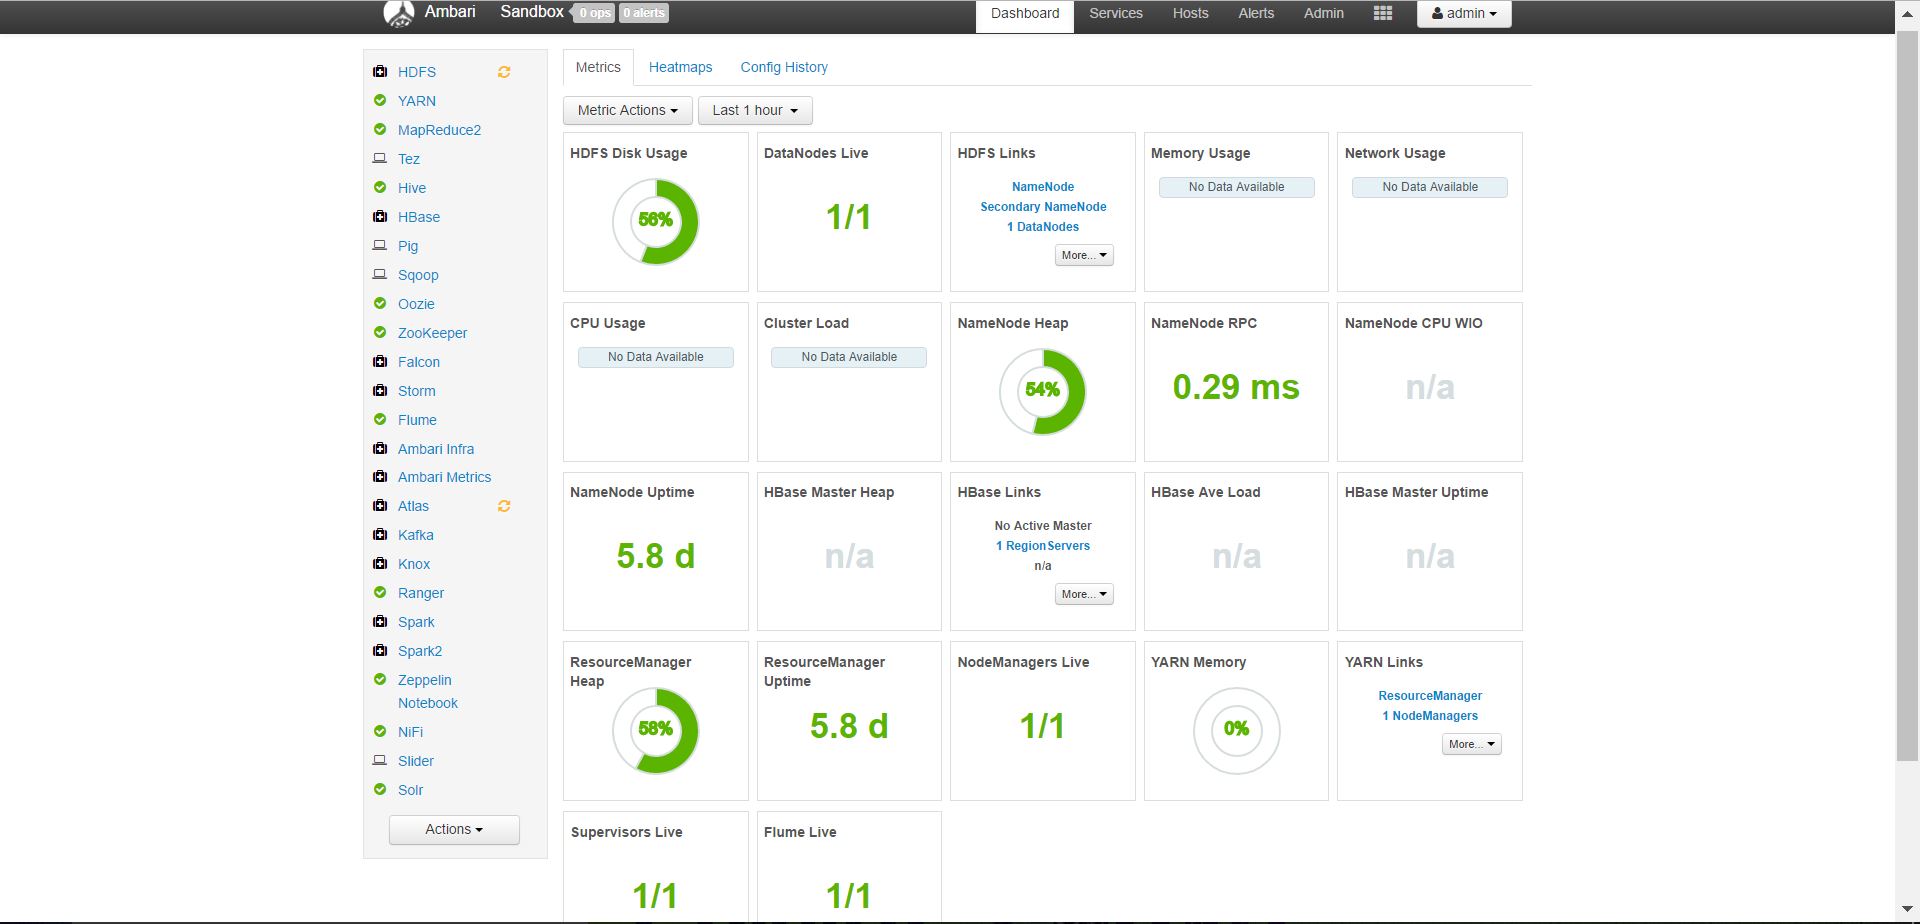
One thing to point out: the "java.net.ConnectException: Connection refused" error is not related. It just means that Ambari metrics service is probably not started - it's usually turned off by default on sandbox, to conserve resources
From the screenshots it seems the flow was started and tweets are flowing. If you can not query them in Solr UI/APIs, I would check if the PutSolrContentStream processor in Nifi is showing any errors - sometimes the zookeeper zknode that solr is using may not be correctly specified in its settings. In this example, I used the Solr ambari service which usually sets up Solr to use /solr zknode

If you are able to query tweets in Solr, but not in Banana try to switch the "Time Window" or re-installing the .json file for the dashboard
Created 10-29-2016 11:40 AM
- Mark as New
- Bookmark
- Subscribe
- Mute
- Subscribe to RSS Feed
- Permalink
- Report Inappropriate Content
@Ali Bajwa Just wanted to request you if you can help me with this. Thanks.
Created 10-29-2016 04:17 PM
- Mark as New
- Bookmark
- Subscribe
- Mute
- Subscribe to RSS Feed
- Permalink
- Report Inappropriate Content
can you post the logs? it should have more details.
Is SOLR and Banana installed and running? Can you check those?
What component is that error on?
Do you have the twitter setup? Did you create a twitter app with Read/Write/Direct Message and grabbed those four values?
Created 10-29-2016 04:18 PM
- Mark as New
- Bookmark
- Subscribe
- Mute
- Subscribe to RSS Feed
- Permalink
- Report Inappropriate Content
do you see anything in data provenance at any of the components?
Created 10-30-2016 02:00 AM
- Mark as New
- Bookmark
- Subscribe
- Mute
- Subscribe to RSS Feed
- Permalink
- Report Inappropriate Content
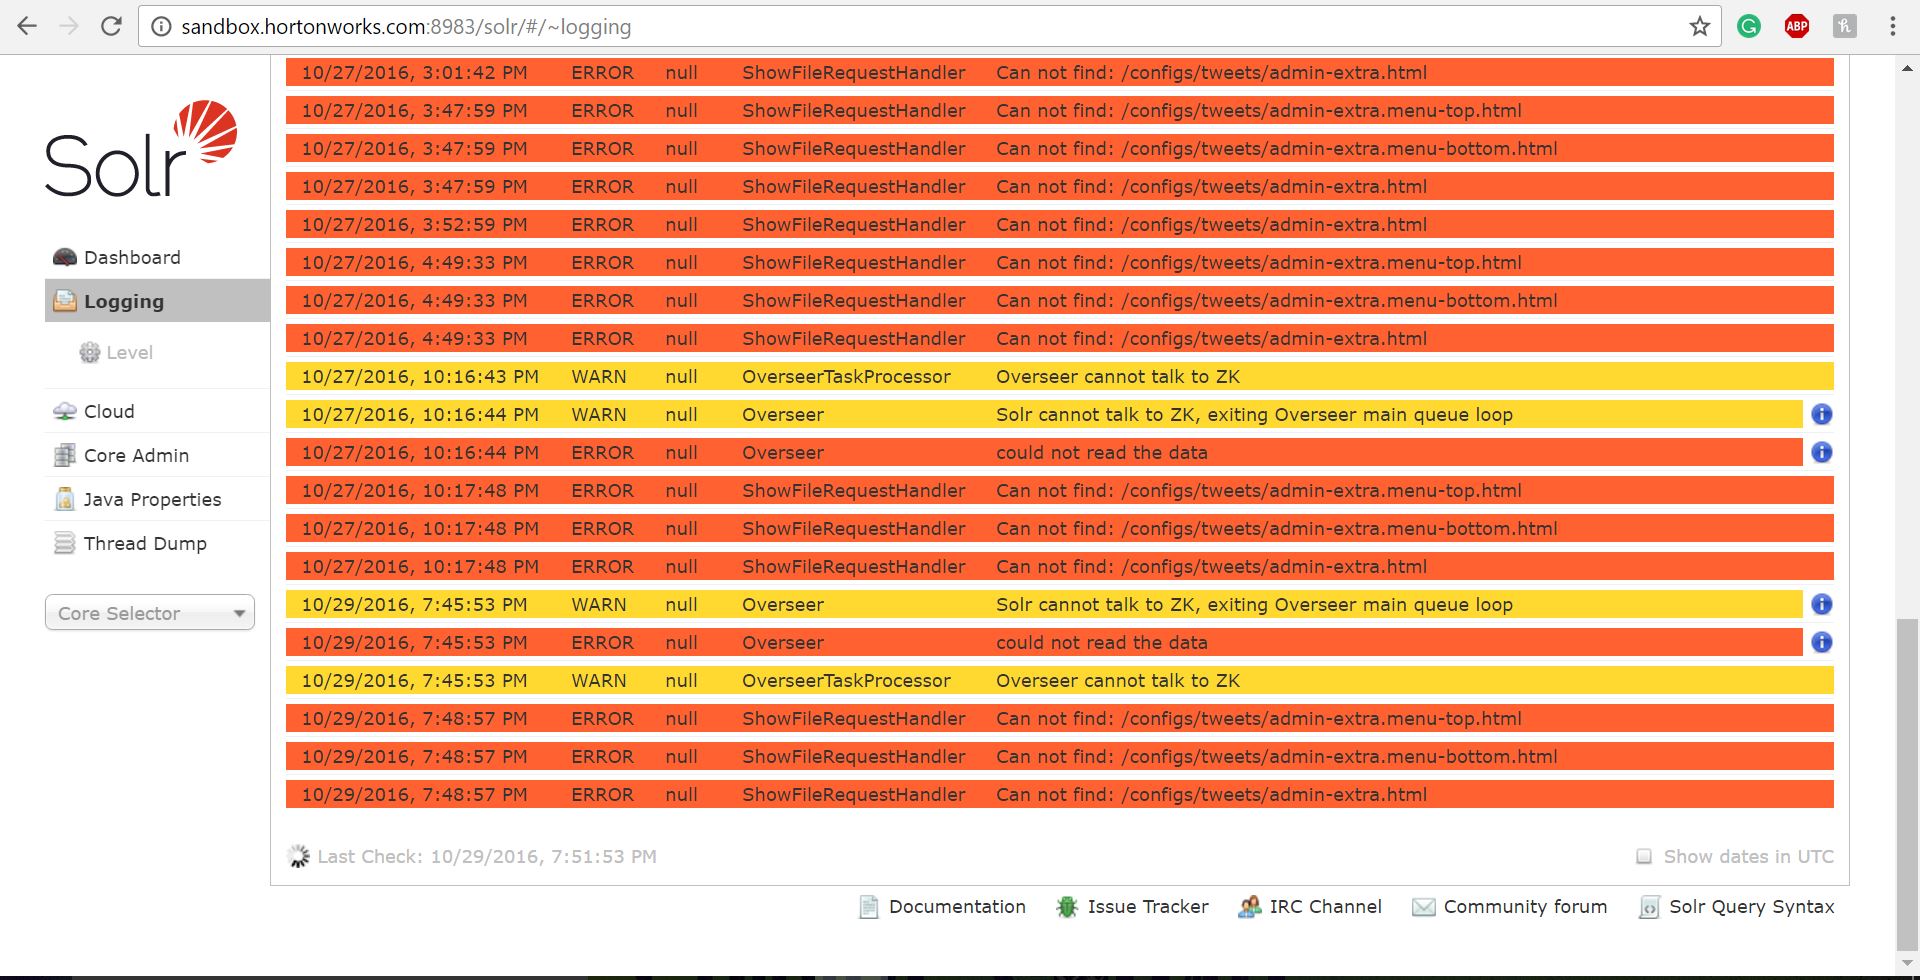
solr-logging.jpgsolr-stats.jpgYes, Solr and Banana are working I have attached the snapshots please have a look. Yes, I have created the Twitter App and configured the four values. I have set the Twitter app permission as Read Only.
What I have already tried:
Note: I have followed every bit of this page.
http://hortonworks.com/hadoop-tutorial/how-to-refine-and-visualize-sentiment-data/
1. Checked Port Forwarding of the NiFi under Network settings of Hortonworks Sandbox.
2. Ensured the time on sandbox is accurate:
- yum install -y ntp
- service ntpd stop
- ntpdate pool.ntp.org
- service ntpd start
3. Deleted the Twitter App and created a new one.
P.S. I am just a beginner with all this and trying to learn while doing sentiment analysis, in case you want me to do anything specific to check something to give more details please do inform me.
Thanks
Created 10-31-2016 05:16 AM
- Mark as New
- Bookmark
- Subscribe
- Mute
- Subscribe to RSS Feed
- Permalink
- Report Inappropriate Content
It looks like you have a problem with your SolrCloud Zookeeper configuration.
Overseer cannot talk to ZK
Are you storing your Solr Index in HDFS or on local disks?
Could you please check your solrcloud configuration especially the ZK Quorum and maybe post the configuration files (solrconfig.xml of the collection, solr.in.sh of your solr cloud)
Is this a secured environment?
Created on 11-02-2016 06:56 PM - edited 08-18-2019 05:17 AM
- Mark as New
- Bookmark
- Subscribe
- Mute
- Subscribe to RSS Feed
- Permalink
- Report Inappropriate Content
One thing to point out: the "java.net.ConnectException: Connection refused" error is not related. It just means that Ambari metrics service is probably not started - it's usually turned off by default on sandbox, to conserve resources
From the screenshots it seems the flow was started and tweets are flowing. If you can not query them in Solr UI/APIs, I would check if the PutSolrContentStream processor in Nifi is showing any errors - sometimes the zookeeper zknode that solr is using may not be correctly specified in its settings. In this example, I used the Solr ambari service which usually sets up Solr to use /solr zknode
If you are able to query tweets in Solr, but not in Banana try to switch the "Time Window" or re-installing the .json file for the dashboard
Created 11-04-2016 05:27 AM
- Mark as New
- Bookmark
- Subscribe
- Mute
- Subscribe to RSS Feed
- Permalink
- Report Inappropriate Content
Right on! This worked for me. Thanks a ton! What I did: 1. Deleted my sandbox and re-installed it.
2. Configured PutSolrContentStream processor's Solr Location to localhost:2181/solr
3. Turned on Ambari metrics service. I really appreciate your input. Thanks for sparing the time.
Created 11-07-2016 04:17 PM
- Mark as New
- Bookmark
- Subscribe
- Mute
- Subscribe to RSS Feed
- Permalink
- Report Inappropriate Content
Thanks for the feedback @Amod Gehlot. I have updated the original HCC article with this info for others as well
Created 11-08-2016 06:58 AM
- Mark as New
- Bookmark
- Subscribe
- Mute
- Subscribe to RSS Feed
- Permalink
- Report Inappropriate Content
thnx @Ali Bajwa

