Support Questions
- Cloudera Community
- Support
- Support Questions
- Re: Why does NiFi performance slow down?
- Subscribe to RSS Feed
- Mark Question as New
- Mark Question as Read
- Float this Question for Current User
- Bookmark
- Subscribe
- Mute
- Printer Friendly Page
- Subscribe to RSS Feed
- Mark Question as New
- Mark Question as Read
- Float this Question for Current User
- Bookmark
- Subscribe
- Mute
- Printer Friendly Page
Why does NiFi performance slow down?
- Labels:
-
Apache HBase
-
Apache NiFi
Created on 04-04-2018 12:39 PM - edited 08-17-2019 09:18 PM
- Mark as New
- Bookmark
- Subscribe
- Mute
- Subscribe to RSS Feed
- Permalink
- Report Inappropriate Content
Hi!
We have a mini HDP + HDF cluster. Our cluster contains 8 VMs + 1 VM as FTP on CentOS7.
* 1 ambari
* 4 HBase
* 3 NiFi
Versions
HDP 2.6.4.0
HDF 3.1
Nifi 1.5
Maximum timer driven thread count: 25
Ambari components (8 Gb, 2 CPU)
* HBase Master (3 Gb)
* HDFS Client
* Metrics Collector (512 Mb)
* Grafana
* Metrics Monitor
* NameNode (1 Gb)
* SNameNode
* ZooKeeper Server (1 Gb)
HBase components (12 Gb, 4 CPU per VM)
* DataNode (3 Gb)
* HBase Client
* RegionServer (8 Gb)
* HDFS Client
* Metrics Monitor
* ZooKeeper Client
NiFi components (19 Gb, 5 CPU per VM)
* Metrics Monitor
* NiFi (15 Gb)
* ZooKeeper Client
* ZooKeeper Server (1 Gb)
* (NiFi Registry - only on 1 vm) (512 Mb)
* (NiFi Certificate Authority - only on 1 vm)
NiFi processors (Concurrent tasks)
* ListFTP (1) (Primary node only)
* Fetch FTP (1)
* ValidateXml (3)
* TransformXml (3)
* ReplaceTextWithMapping (2)
* ValidateCsv (1)
* 2 ReplaceText (1)
* PutHBaseRecord (5)
We need to benchmark this cluster.
The flow is:
1. Read from FTP with NiFi.
2. Make some data transformation with NiFi, standard + custom processors.
3. Write result to HBase with PuHBase processor.
The problem is the performance change.
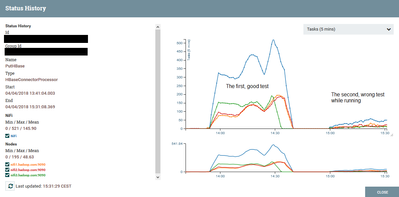
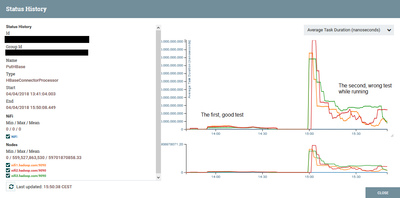
At the first test (empty HBase, empty NiFi repos, restarted VMs) the duration of the test is good (~90 Gb data during ~50 min).
After this we truncate the HBase table and we wait some time (~1 hour) for teardown before repeat the same test.
We make the test again (empty HBase, not empty NiFi repos, not restarted VMs, not restarted service, same data as before), but the performance is very low, now it takes ~5 hour long.
It looks like the PutHBaseRecord processor is slower in the second run when we get wrong performance. All queues are getting full in this case
If we restart the NiFi service or NiFi VMs and make the test again, the performance is good again, ~50 min.
We tried with another amount of data (~450 Gb data) in this case, we found the same issue.
In good case this was ~260 min (x5 data => x5 time), but in the wrong case it was much more (we stopped the test after 8 hour).
For NiFi we set these configs (https://nifi.apache.org/docs/nifi-docs/html/administration-guide.html#configuration-best-practices).
For HBase we use Memstore Flush Size: 256Mb, HBase Region Block Multiplier: 8 and Number of Handlers per RegionServer: 100.
Has anyone experienced a similar performance change or is there some idea to avoid this?
Here is two pictures about the good and wrong tests. These are the status history of PutHBase.
Created 04-04-2018 12:42 PM
- Mark as New
- Bookmark
- Subscribe
- Mute
- Subscribe to RSS Feed
- Permalink
- Report Inappropriate Content
Do you see anything in the logs?
That is not normal behavior.
I would like more RAM, in the bootstrap.conf?
# JVM memory settings
java.arg.2=-Xms14G
java.arg.3=-Xmx14G
Created 04-04-2018 01:58 PM
- Mark as New
- Bookmark
- Subscribe
- Mute
- Subscribe to RSS Feed
- Permalink
- Report Inappropriate Content
# JVM memory settings
java.arg.2=-Xms{{nifi_initial_mem}}
java.arg.3=-Xmx{{nifi_max_mem}}
In Ambari Advanced nifi-ambari-config:
Initial memory allocation=2048m
Max memory allocation=15360m
In the log files i don't see any error or warning.
I set the log level of the PutHBaseRecord processor to debug to see more details but nothing. (Added to the logback.xml this:)
<logger name="org.apache.nifi.processors.PutHBaseRecord" level="DEBUG"/>
I got only once a maybe relevant info log in one from three VMs nifi-app.log:
INFO [Timer-Driven Process Thread-16] o.a.hadoop.hbase.client.AsyncProcess #92930, waiting for some tasks to finish. Expected max=0, tasksInProgress=2
Created 09-04-2021 02:54 PM
- Mark as New
- Bookmark
- Subscribe
- Mute
- Subscribe to RSS Feed
- Permalink
- Report Inappropriate Content
A bit late to the party, but do you (or anyone else who might have encountered this problem) have any extra info to share about it? I am currently experiencing a similar issue.


