Support Questions
- Cloudera Community
- Support
- Support Questions
- Re: impala执行部分查询语句时,[客户端获取等待时间]占整体时间占比很高,导致过慢 (Whe...
- Subscribe to RSS Feed
- Mark Question as New
- Mark Question as Read
- Float this Question for Current User
- Bookmark
- Subscribe
- Mute
- Printer Friendly Page
- Subscribe to RSS Feed
- Mark Question as New
- Mark Question as Read
- Float this Question for Current User
- Bookmark
- Subscribe
- Mute
- Printer Friendly Page
impala执行部分查询语句时,[客户端获取等待时间]占整体时间占比很高,导致过慢 (When impala executes some query statements, [client acquisition waiting time] accounts for a high proportion of the overall time, resulting in too slow)
- Labels:
-
Apache Impala
Created on
03-02-2023
02:21 AM
- last edited on
03-02-2023
08:04 AM
by
DianaTorres
- Mark as New
- Bookmark
- Subscribe
- Mute
- Subscribe to RSS Feed
- Permalink
- Report Inappropriate Content
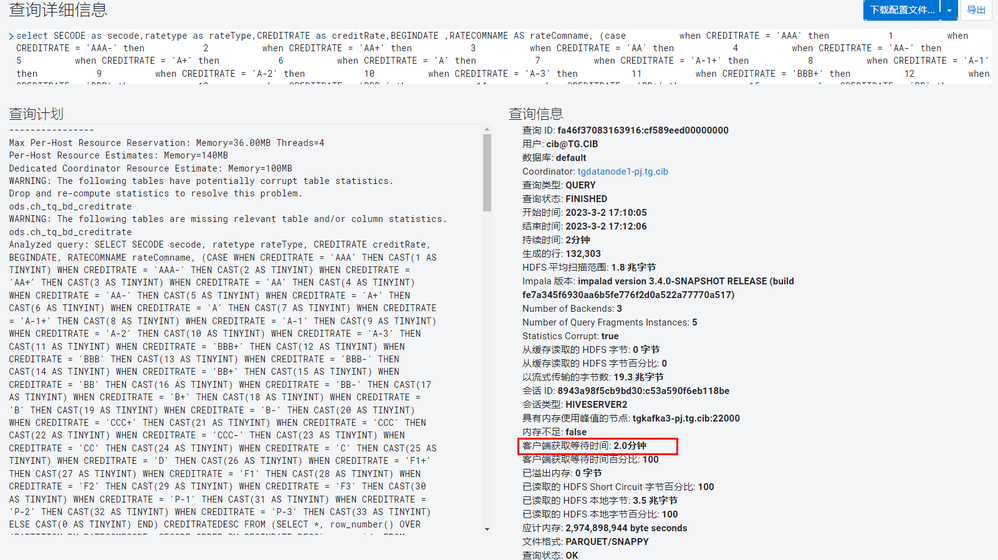
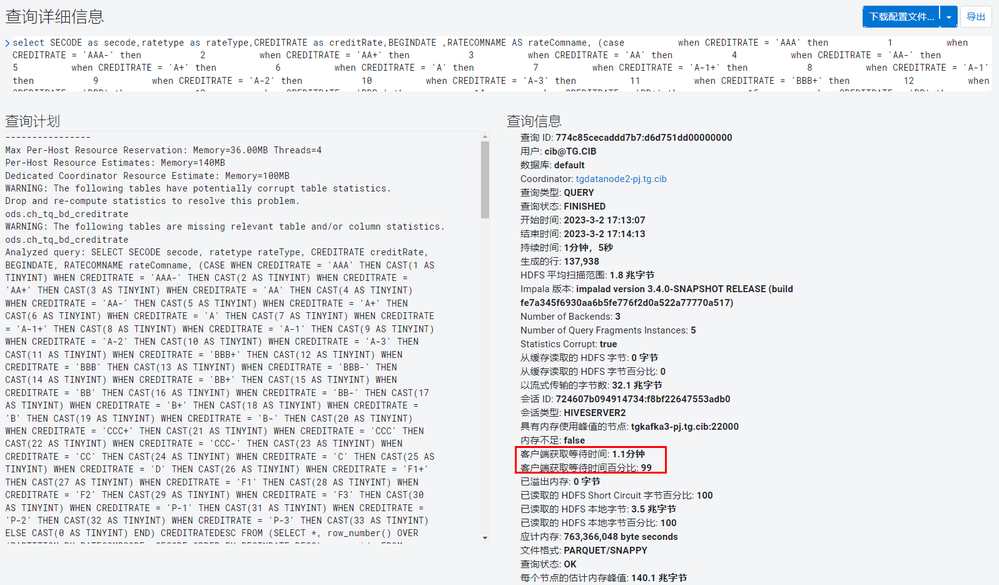
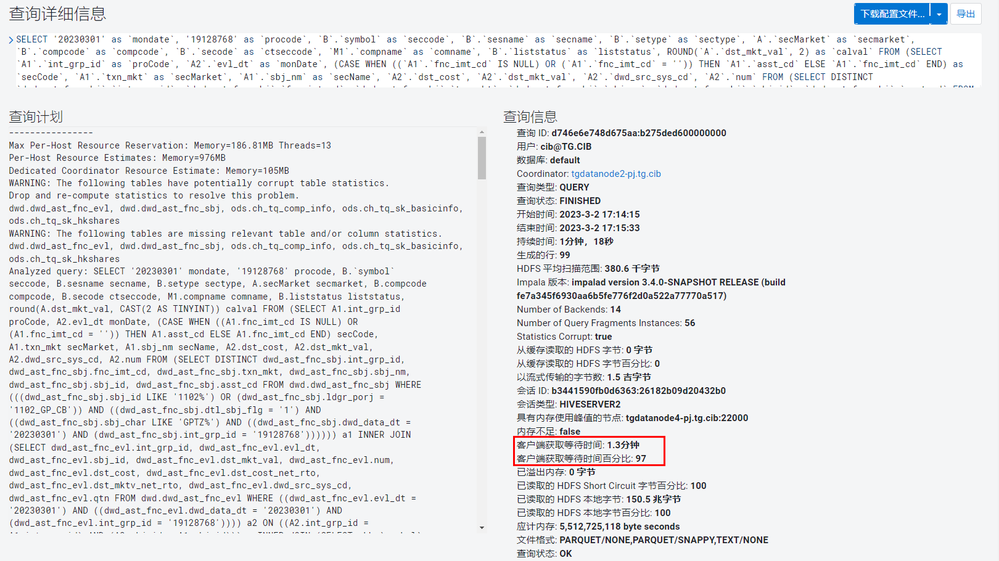
impala执行sql语句时速度不稳定,同样类型的sql存在十几秒完成,也存在几分钟才完成,从sql执行持续时间上来看,[客户端获取等待时间]占整体时间占比很高,请问是什么因素会影响[客户端获取等待时间]
负载均衡中间件:Haproxy
负载超时时间设置:30m
查询慢的脚本


Created 03-06-2023 04:30 AM
- Mark as New
- Bookmark
- Subscribe
- Mute
- Subscribe to RSS Feed
- Permalink
- Report Inappropriate Content
Hi @KaimingGu , the translation might have been incorrect, so I assume you're actually facing "Client Fetch Wait Time" taking the most of the time. At the same time the "Client Fetch Wait Time Percentage" is also close to 100%.
This means that while the query has been executed quicky, the client was too slow to fetch the results. This is usually a sign that the network may be slow or the client is facing other slowness, for example it does some processing between the "result.next()" calls, or hitting GC pauses (if it's a Java application).
See also the following blog post which explains the different query profile metrics:
https://www.ericlin.me/2020/02/impala-query-profile-explained-part-5-query-metrics/
Best regards
Miklos Szurap
Customer Operations Engineer, Cloudera
Created 03-02-2023 07:14 AM
- Mark as New
- Bookmark
- Subscribe
- Mute
- Subscribe to RSS Feed
- Permalink
- Report Inappropriate Content
Translation:
When impala executes SQL statements, the speed is unstable. The same type of SQL may take more than ten seconds to complete, and it may take several minutes to complete. From the perspective of SQL execution duration, [Client Acquisition Waiting Time] accounts for a high proportion of the overall time. May I ask? What factors will affect [client acquisition wait time]
Load balancing middleware: Haproxy
Load timeout setting: 30m
Regards,
Diana Torres,Senior Community Moderator
Was your question answered? Make sure to mark the answer as the accepted solution.
If you find a reply useful, say thanks by clicking on the thumbs up button.
Learn more about the Cloudera Community:
Created 03-06-2023 04:30 AM
- Mark as New
- Bookmark
- Subscribe
- Mute
- Subscribe to RSS Feed
- Permalink
- Report Inappropriate Content
Hi @KaimingGu , the translation might have been incorrect, so I assume you're actually facing "Client Fetch Wait Time" taking the most of the time. At the same time the "Client Fetch Wait Time Percentage" is also close to 100%.
This means that while the query has been executed quicky, the client was too slow to fetch the results. This is usually a sign that the network may be slow or the client is facing other slowness, for example it does some processing between the "result.next()" calls, or hitting GC pauses (if it's a Java application).
See also the following blog post which explains the different query profile metrics:
https://www.ericlin.me/2020/02/impala-query-profile-explained-part-5-query-metrics/
Best regards
Miklos Szurap
Customer Operations Engineer, Cloudera
Created 03-10-2023 07:57 AM
- Mark as New
- Bookmark
- Subscribe
- Mute
- Subscribe to RSS Feed
- Permalink
- Report Inappropriate Content
@KaimingGu Has the reply helped resolve your issue? If so, please mark the appropriate reply as the solution, as it will make it easier for others to find the answer in the future. Thanks
Regards,
Diana Torres,Senior Community Moderator
Was your question answered? Make sure to mark the answer as the accepted solution.
If you find a reply useful, say thanks by clicking on the thumbs up button.
Learn more about the Cloudera Community:


