Support Questions
- Cloudera Community
- Support
- Support Questions
- Re: Cloudera Manager services show unknown health ...
- Subscribe to RSS Feed
- Mark Question as New
- Mark Question as Read
- Float this Question for Current User
- Bookmark
- Subscribe
- Mute
- Printer Friendly Page
- Subscribe to RSS Feed
- Mark Question as New
- Mark Question as Read
- Float this Question for Current User
- Bookmark
- Subscribe
- Mute
- Printer Friendly Page
Cloudera Manager services show unknown health status
Created on 06-08-2016 06:53 PM - edited 09-16-2022 03:24 AM
- Mark as New
- Bookmark
- Subscribe
- Mute
- Subscribe to RSS Feed
- Permalink
- Report Inappropriate Content
Hi Everyone !
After leaving CM not used for a week during a holiday I returned to an unknown health status issue
Everything was up and running fine before !
I have successfully got up and running a 3 node CDH Cluster with 4 go RAM in each and also 1 TB hard disc space for each (I am to add a fourth node soon) .
Hostnames are Childnode1, Childnode2 and Masterdatanode. Masterdatanode has Cloudera Manager installed
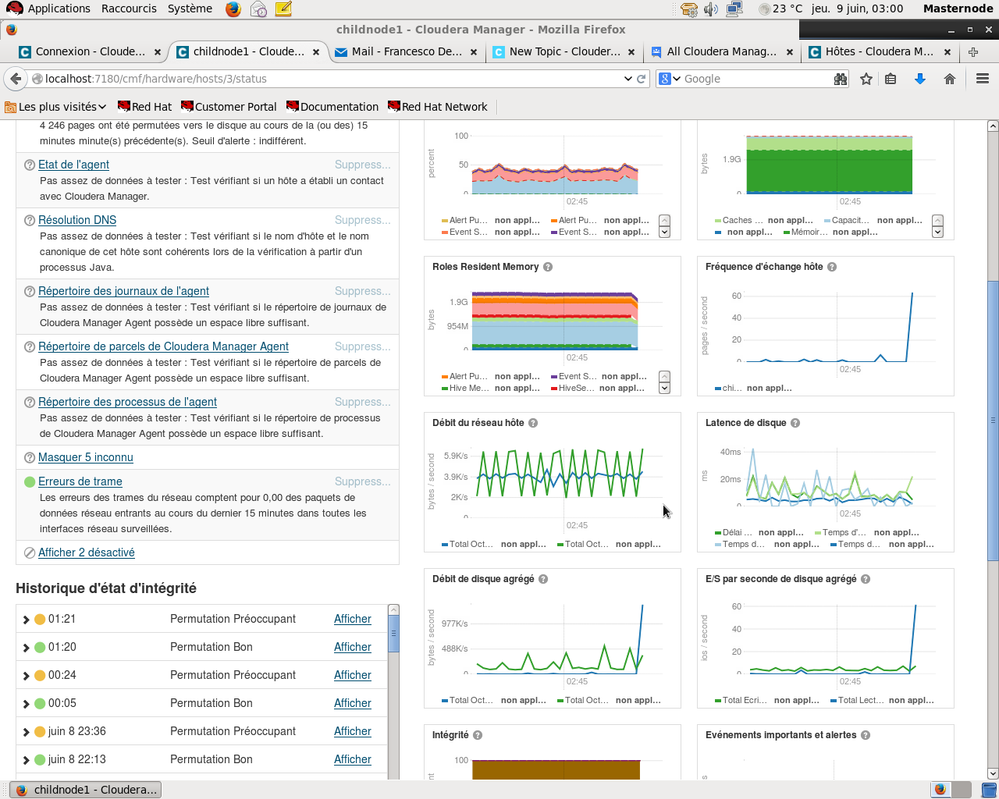
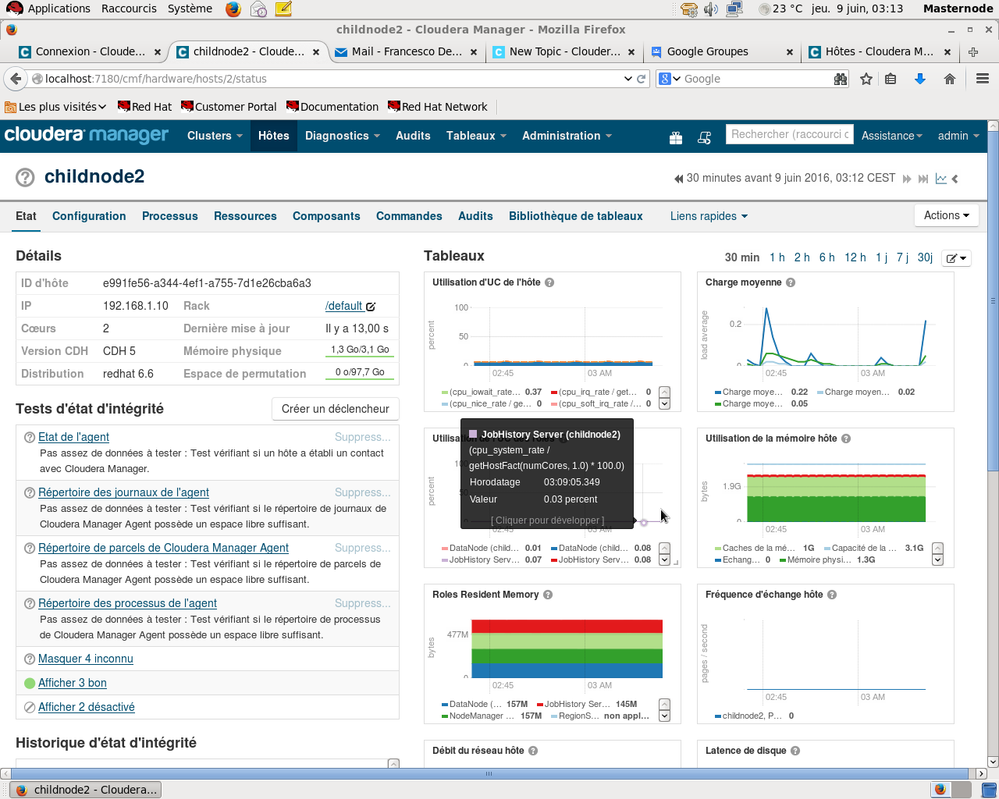
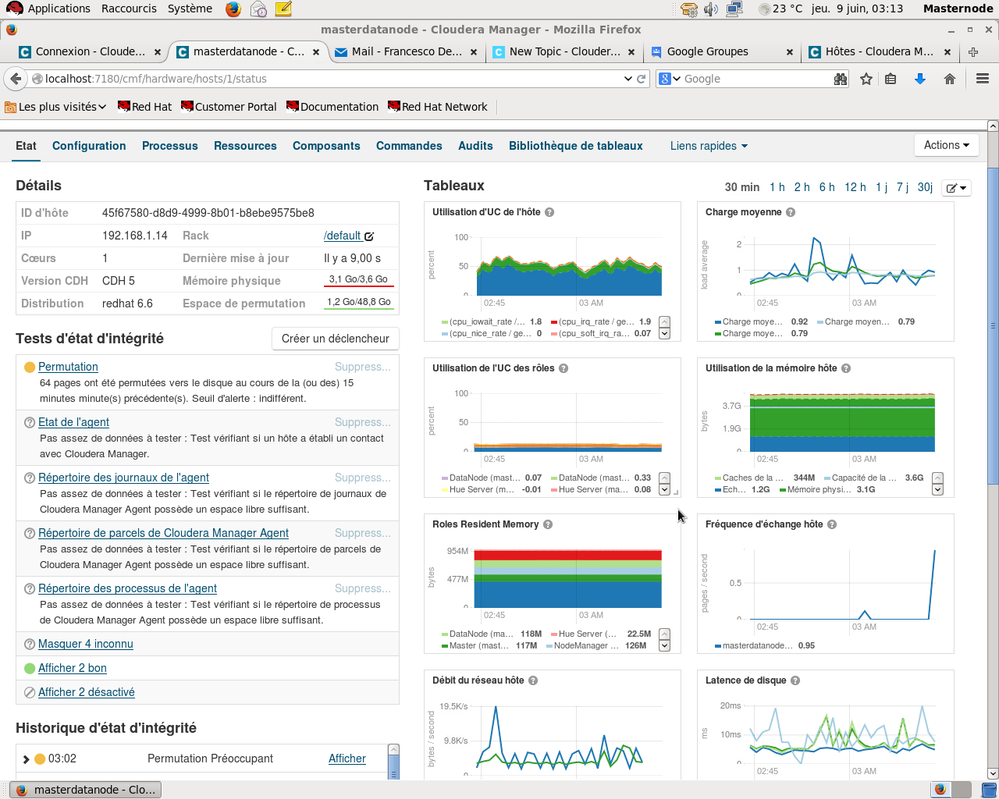
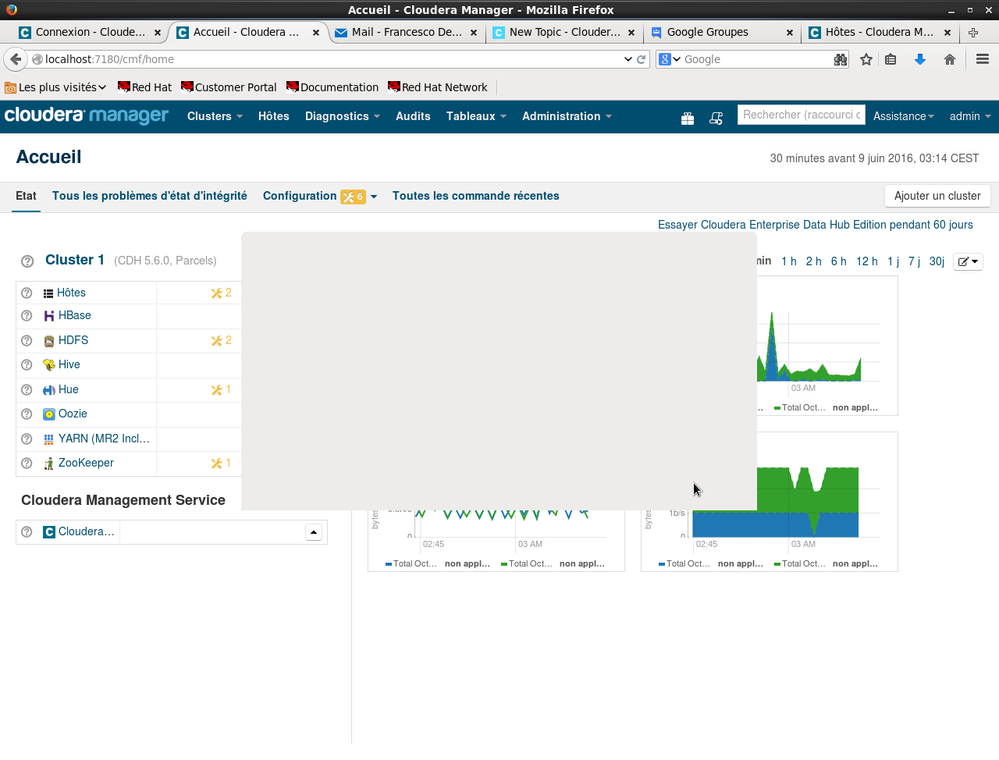
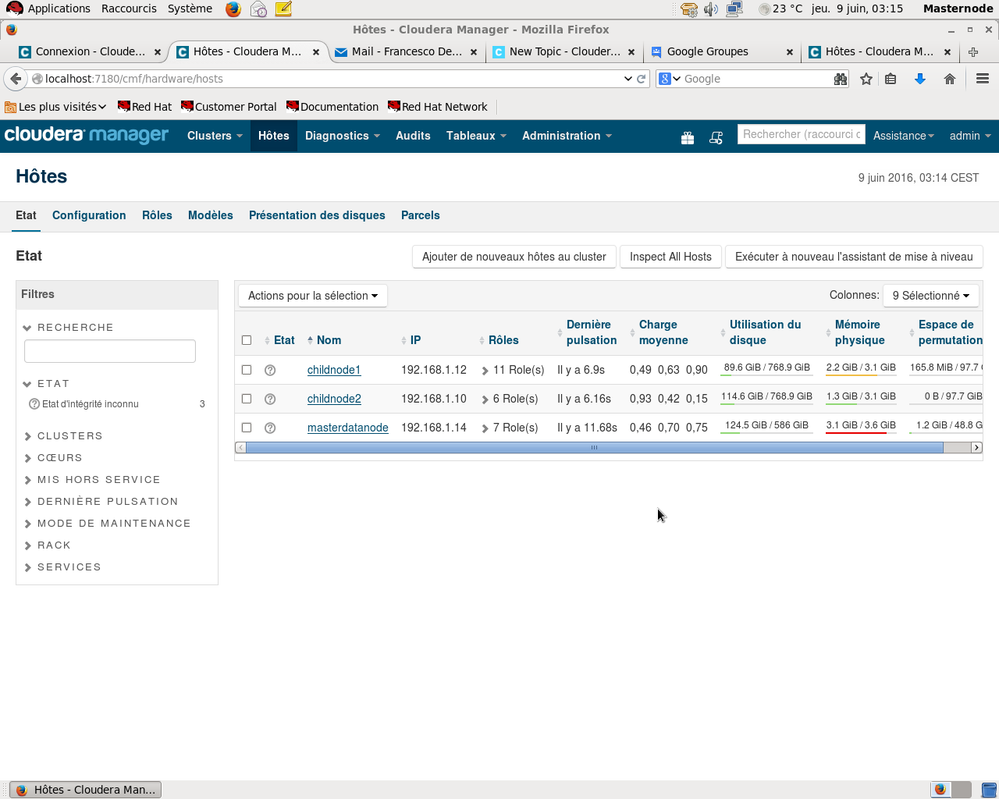
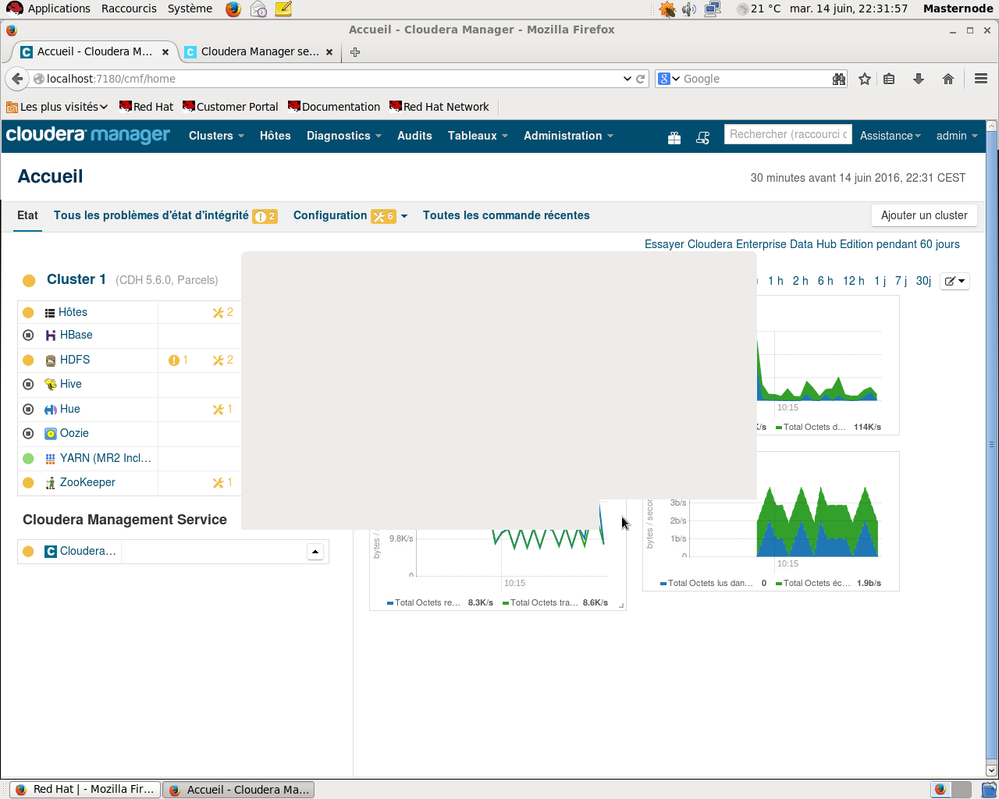
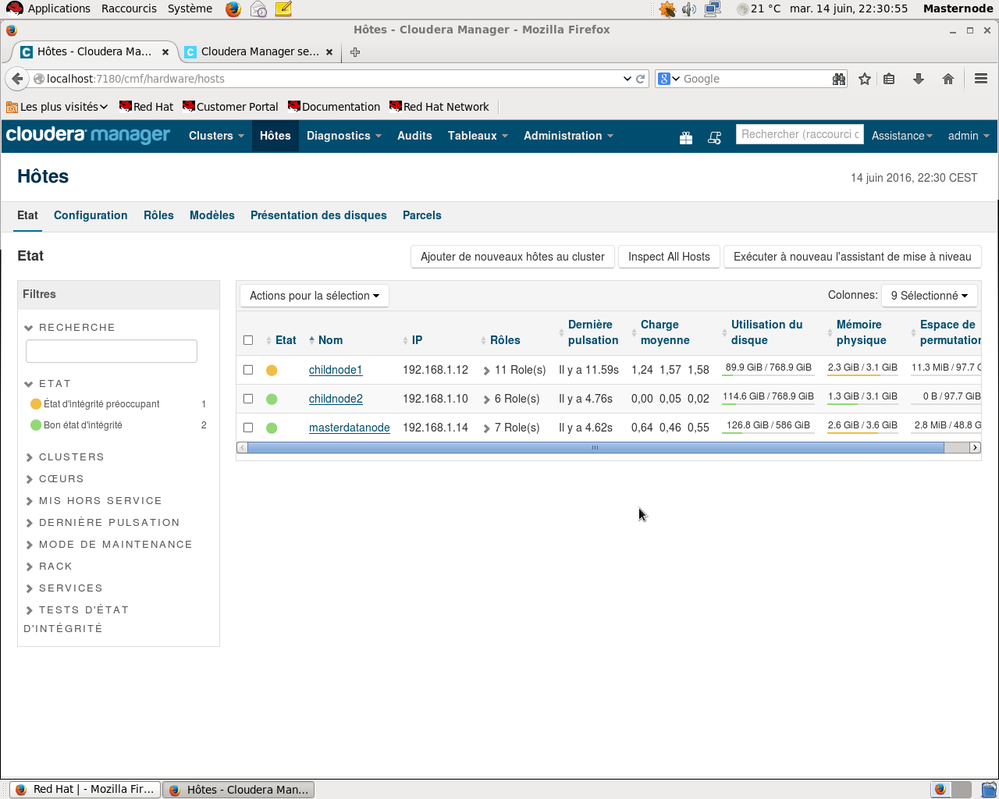
I have attached the screen shots of the CM UI's and the host and welcome pages (note they are in French)
I often see in the health check explanations:Not enough data to test: Test to verify if a host has established contact with Cloudera Manager
ie In French :Pas assez de données à tester : Test vérifiant si un hôte a établi un contact avec Cloudera Manager.
As you can see from the screenshots all services are up and running
I sometimes get the message on start up (When there are no charts and tables)
" Internal error while querying the host monitor "
But this goes away when I restart Cloudera Management services
Cloudera Manager server and agents are okay the agents are heartbeating normally as you can see from the hosts page screenshot
There must be something straight forward wrong as all icons show unknown health status (little question mark)
Can someone offer some help ?
Created 06-17-2016 09:05 AM
- Mark as New
- Bookmark
- Subscribe
- Mute
- Subscribe to RSS Feed
- Permalink
- Report Inappropriate Content
Thanks a lot you guys the problem is solved !!!
I carried out a number of configuration changes including increasing the heap size as recommended, briefly
1 I realigned the "decalage horloge" which was about 2mins on my cluster
2 I increased the java heap pile from 256 to 512mb on the Host and Service monitor
3 I stopped a few unnecessary services on the cluster, ie HBase Hive Hue and Oozie
I will explain the last step quickly
One of the Cluster configuration problems is the surcharge on the memory of host CHILDNODE1. This host has 11 roles allocated to it which leads to health problems. Therefore I am to reallocate the roles among the hosts. Which was why I mentioned in my last post I am going to add a new host. To do just this
The new 2 screenshots now show all health status reports working okay (the concerning health status comes primarily from the overloaded host CHILNODE1)
Some final thoughts/questions on good housekeeping
1 Should I stop all services on a nightly basis when I retire and before I log off from Cloudera Manager. And restart them after I have logged onto Cloudera Manager ? This would have avoided the problems I encountered after my holiday.
2 One can run hadoop jobs with Cloudera Manager showing good or concerning health status but not bad health status. Is this so ?
Thanks again
Created 06-09-2016 05:53 AM
- Mark as New
- Bookmark
- Subscribe
- Mute
- Subscribe to RSS Feed
- Permalink
- Report Inappropriate Content
Hello, while I cannot see your attached screenshots yet, this type of condition is usually caused when one (or both) of the roles
- Service Monitor
- Host Monitor
are not running. These roles are responsible for gathering and displaying the state of everything else within the cluster, so when you see no charts or tables, the immediate subject of review should be these two roles. You explain that restarting the Cloudera Management Services sometimes resolves the issue temporarily; Host Monitor and Service Monitor are roles under the Cloudera Management Service so that would explain why the full restart clears the issue for a time.
In the case of this smaller cluster you are running, it is likely Host Monitor and Service Monitor experienced an Out of Memory exception and have unexpectedly exited. Increasing heap configuration could help there.
I will check again soon to see if I can view your screenshots and provide a more full answer.
Created 06-09-2016 06:18 AM
- Mark as New
- Bookmark
- Subscribe
- Mute
- Subscribe to RSS Feed
- Permalink
- Report Inappropriate Content
The screen shots should be showing now. 🙂
Cy Jervis, Manager, Community Program
Was your question answered? Make sure to mark the answer as the accepted solution.
If you find a reply useful, say thanks by clicking on the thumbs up button.
Created 06-17-2016 09:05 AM
- Mark as New
- Bookmark
- Subscribe
- Mute
- Subscribe to RSS Feed
- Permalink
- Report Inappropriate Content
Thanks a lot you guys the problem is solved !!!
I carried out a number of configuration changes including increasing the heap size as recommended, briefly
1 I realigned the "decalage horloge" which was about 2mins on my cluster
2 I increased the java heap pile from 256 to 512mb on the Host and Service monitor
3 I stopped a few unnecessary services on the cluster, ie HBase Hive Hue and Oozie
I will explain the last step quickly
One of the Cluster configuration problems is the surcharge on the memory of host CHILDNODE1. This host has 11 roles allocated to it which leads to health problems. Therefore I am to reallocate the roles among the hosts. Which was why I mentioned in my last post I am going to add a new host. To do just this
The new 2 screenshots now show all health status reports working okay (the concerning health status comes primarily from the overloaded host CHILNODE1)
Some final thoughts/questions on good housekeeping
1 Should I stop all services on a nightly basis when I retire and before I log off from Cloudera Manager. And restart them after I have logged onto Cloudera Manager ? This would have avoided the problems I encountered after my holiday.
2 One can run hadoop jobs with Cloudera Manager showing good or concerning health status but not bad health status. Is this so ?
Thanks again
Created 01-19-2017 11:52 AM
- Mark as New
- Bookmark
- Subscribe
- Mute
- Subscribe to RSS Feed
- Permalink
- Report Inappropriate Content
Hi,
I am also stuck with similar issue. Could you please let me know how to increase the java heap pile from 256 to 512mb on the Host and Service monitor?
Thanks in advance.
Created 01-25-2017 12:03 PM
- Mark as New
- Bookmark
- Subscribe
- Mute
- Subscribe to RSS Feed
- Permalink
- Report Inappropriate Content
You can search for 'heap size' in Service Monitor and Host Monitor's configuration page. Make sure they are restarted after you save your configuration changes.
