Support Questions
- Cloudera Community
- Support
- Support Questions
- Re: HDFS is almost full 90% but data node disks ar...
- Subscribe to RSS Feed
- Mark Question as New
- Mark Question as Read
- Float this Question for Current User
- Bookmark
- Subscribe
- Mute
- Printer Friendly Page
- Subscribe to RSS Feed
- Mark Question as New
- Mark Question as Read
- Float this Question for Current User
- Bookmark
- Subscribe
- Mute
- Printer Friendly Page
HDFS is almost full 90% but data node disks are around 50%
Created on 09-03-2018 05:05 PM - edited 08-18-2019 02:05 AM
- Mark as New
- Bookmark
- Subscribe
- Mute
- Subscribe to RSS Feed
- Permalink
- Report Inappropriate Content
hi all
we have ambari cluster version 2.6.1 & HDP version 2.6.4
from the dashboard we can see that HDFS DISK Usage is almost 90%
but all data-node disk are around 90%
so why HDFS show 90% , while datanode disk are only 50%
/dev/sdc                   20G   11G  8.7G  56% /data/sdc
/dev/sde                   20G   11G  8.7G  56% /data/sde
/dev/sdd                   20G   11G  9.0G  55% /data/sdd
/dev/sdb                   20G  8.9G   11G  46% /data/sdb
is it problem of fine-tune ? or else
we also performed re-balance from the ambari GUI but this isn't help
Created on 09-05-2018 12:56 AM - edited 08-18-2019 02:05 AM
- Mark as New
- Bookmark
- Subscribe
- Mute
- Subscribe to RSS Feed
- Permalink
- Report Inappropriate Content
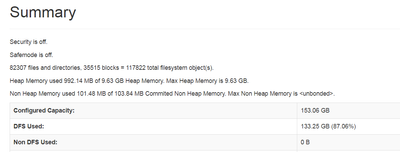
As the NameNode Report and UI (including ambari UI) shows that your DFS used is reaching almsot 87% to 90% hence it will be really good if you can increase the DFS capacity.
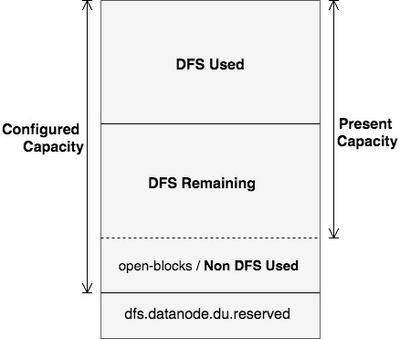
In order to understand in detail about the Non DFS Used = Configured Capacity - DFS Remaining - DFS Used
YOu can refer to the following article which aims at explaining the concepts of Configured Capacity, Present Capacity, DFS Used,DFS Remaining, Non DFS Used, in HDFS. The diagram below clearly explains these output space parameters assuming HDFS as a single disk.
https://community.hortonworks.com/articles/98936/details-of-the-output-hdfs-dfsadmin-report.html
.
The above is one of the best article to understand the DFS and Non-DFS calculations and remedy.
You add capacity by giving dfs.datanode.data.dir more mount points or directories. In Ambari that section of configs is I believe to the right depending the version of Ambari or in advanced section, the property is in hdfs-site.xml. the more new disk you provide through comma separated list the more capacity you will have. Preferably every machine should have same disk and mount point structure.
.
Created on 09-04-2018 01:35 AM - edited 08-18-2019 02:05 AM
- Mark as New
- Bookmark
- Subscribe
- Mute
- Subscribe to RSS Feed
- Permalink
- Report Inappropriate Content
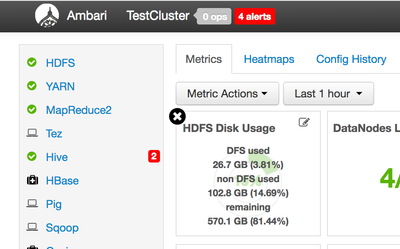
The HDFS dashboard metrics widget "HDFS Disk Usage" shows: \The percentage of distributed file system (DFS) used, which is a combination of DFS and non-DFS used.
So can you just put your mouse over the "HDFS Disk Usage" widget and then see what is the different values do you see there for "DFS Used" , "non DFS Used" and Remaining. You should see something like following:
.
Created on 09-04-2018 04:44 AM - edited 08-18-2019 02:05 AM
- Mark as New
- Bookmark
- Subscribe
- Mute
- Subscribe to RSS Feed
- Permalink
- Report Inappropriate Content
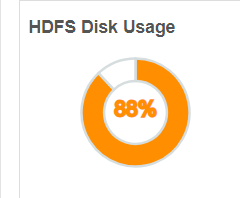
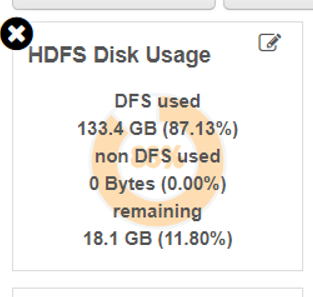
@Jay , this is what we got: ( so this is like 88% used ) , and regarding my question , how it can be 88% when disk are ~50%
Created 09-04-2018 05:26 AM
- Mark as New
- Bookmark
- Subscribe
- Mute
- Subscribe to RSS Feed
- Permalink
- Report Inappropriate Content
What do you see when you run the following command?
# su - hdfs -c " hdfs dfsadmin -report | grep 'DFS Used%'
(OR)
Please check the "DFS Used" shown in the NameNode UI to verify if ambari is shoiwng the same data or different? : http://$ACTIVE_NAMENODE:50070/dfshealth.html#tab-overview
Created 09-04-2018 05:25 AM
- Mark as New
- Bookmark
- Subscribe
- Mute
- Subscribe to RSS Feed
- Permalink
- Report Inappropriate Content
@Jay , I want to note that we have 4 datenode machines ( 4 workers machines ) and each worker have 4 disks with 20G
Created 09-04-2018 05:29 AM
- Mark as New
- Bookmark
- Subscribe
- Mute
- Subscribe to RSS Feed
- Permalink
- Report Inappropriate Content
@jay , we got the following results
 su - hdfs -c " hdfs dfsadmin -report | grep 'DFS Used%' "
DFS Used%: 87.38%
DFS Used%: 88.48%
DFS Used%: 87.00%
DFS Used%: 84.70%
DFS Used%: 87.93%
Created 09-04-2018 05:43 AM
- Mark as New
- Bookmark
- Subscribe
- Mute
- Subscribe to RSS Feed
- Permalink
- Report Inappropriate Content
@Jay another info from my datanode about the disk use
datanode1
47% disk1
64% disk2
48% disk3
49% disk4


datanode2
44%
53%
61%
44%


datanode3
55%
46%
45%
91%


datanode4
63%
45%
49%
46%
Created 09-04-2018 06:16 AM
- Mark as New
- Bookmark
- Subscribe
- Mute
- Subscribe to RSS Feed
- Permalink
- Report Inappropriate Content
@Jay do you need other info?
Created on 09-04-2018 09:36 AM - edited 08-18-2019 02:05 AM
- Mark as New
- Bookmark
- Subscribe
- Mute
- Subscribe to RSS Feed
- Permalink
- Report Inappropriate Content
Created 09-04-2018 10:05 AM
- Mark as New
- Bookmark
- Subscribe
- Mute
- Subscribe to RSS Feed
- Permalink
- Report Inappropriate Content
As "HDFS Disk Usage" shows: The percentage of distributed file system (DFS) used, which is a combination of DFS and non-DFS used.
The NameNode commands/UI shows that the DFS Used is around 87.06% and Non DFS Used is 0%
So which is almost same which ambari is showing like almost 88% (DFS + Non DFS Usage) so there seems to be no contradiction to me.
Please let us know what is the value you are expecting.
